

The 7 Metrics That Make or Break Ecommerce Growth
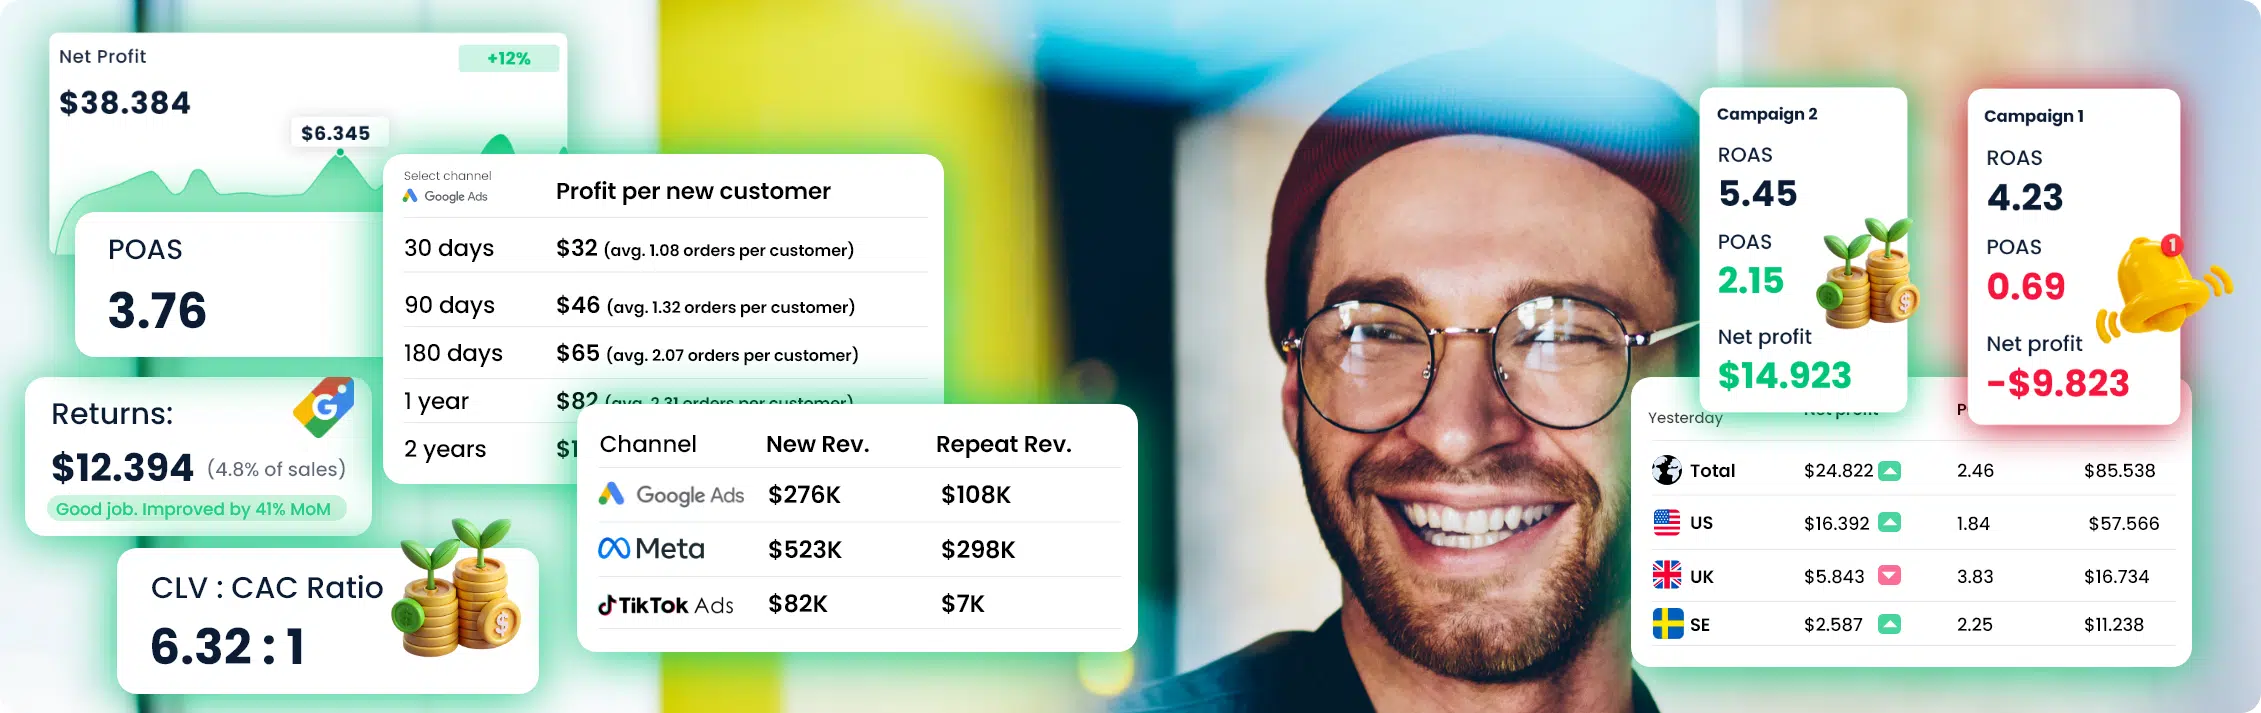
Scaling an e-commerce brand isn’t about guessing what works — it’s about knowing exactly which numbers drive profitable growth. The fastest-growing stores and the agencies behind them don’t just look at vanity metrics like traffic, clicks, and ROAS. They track the metrics that reveal true profitability, guide smarter decision-making, and expose opportunities for scale before the competition sees them.
In this article, we’re breaking down the seven metrics that make or break e-commerce growth. These are the same numbers top-performing brands rely on to outpace the market, from profit-focused marketing metrics to lifetime value insights and multi-market analysis.
If you’re serious about growth, these aren’t “nice to have.” They’re essential.
Teaser: #1 True CAC, #2 POAS, #3 CLV Profits, #4 multi-market, #5 true profit per product, #6 CLV : CAC Ratio and #7 new vs. repeat customer revenue.

#1 True CAC:
Most brands calculate CAC as cost per order, but that’s misleading – not every order comes from a new customer. True CAC means identifying actual first-time buyers by unique identifiers like email, phone number, or customer ID. To do this accurately, it requires server-side tracking combined with an existing customer database lookup. With that in place, you can see – from channel all the way down to campaign, ad, and even keyword level – which efforts are truly acquiring new customers at the lowest cost, instead of wasting budget on repeat buyers disguised as “new.”
True CAC isn’t a nice-to-have in 2025. It’s the difference between growth and wasted spend.
True CAC isn’t a nice-to-have in 2025. It’s the difference between growth and wasted spend.
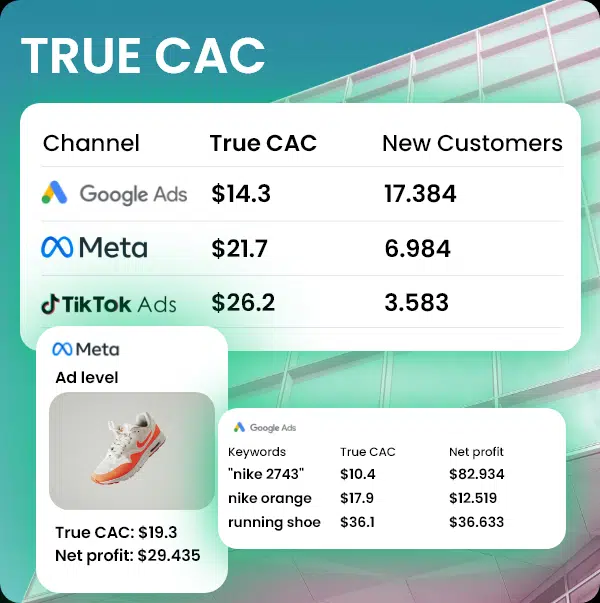
Most brands calculate CAC as cost per order, but that’s misleading – not every order comes from a new customer. True CAC means identifying actual first-time buyers by unique identifiers like email, phone number, or customer ID. To do this accurately, it requires server-side tracking combined with an existing customer database lookup. With that in place, you can see – from channel all the way down to campaign, ad, and even keyword level – which efforts are truly acquiring new customers at the lowest cost, instead of wasting budget on repeat buyers disguised as “new.”
True CAC isn’t a nice-to-have in 2025. It’s the difference between growth and wasted spend.
True CAC isn’t a nice-to-have in 2025. It’s the difference between growth and wasted spend.
#2 POAS:
Profit On Ad Spend
Profit On Ad Spend
ROAS is dead. Why? Different products have different profit margins, and shipping or payment fees can quickly eat into revenue. Profit on Ad Spend (POAS) takes all variable costs into account – COGS, shipping, handling, packaging, payment fees – so you see the real profitability of each channel, campaign, ad, and keyword. With POAS, you can optimize campaigns for true profit instead of just top-line revenue.
POAS shows the real profitability of every channel, campaign, ad, and keyword.
POAS shows the real profitability of every channel, campaign, ad, and keyword.

ROAS is dead. Why? Different products have different profit margins, and shipping or payment fees can quickly eat into revenue. Profit on Ad Spend (POAS) takes all variable costs into account – COGS, shipping, handling, packaging, payment fees – so you see the real profitability of each channel, campaign, ad, and keyword. With POAS, you can optimize campaigns for true profit instead of just top-line revenue.
POAS shows the real profitability of every channel, campaign, ad, and keyword.
POAS shows the real profitability of every channel, campaign, ad, and keyword.
#3 CLV Profits:
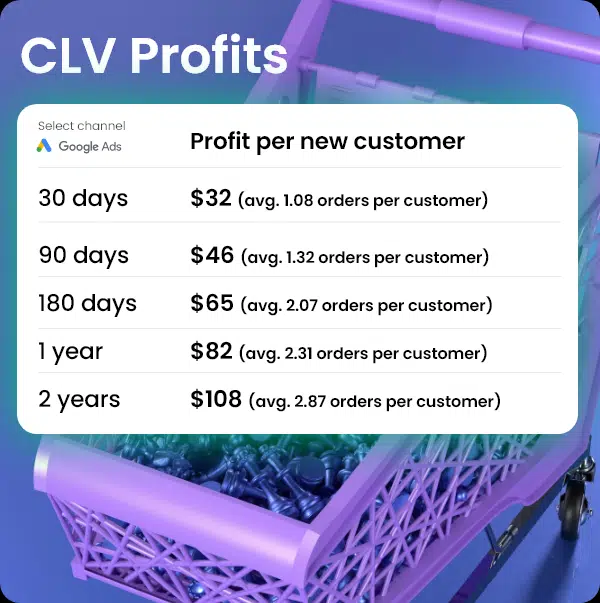
Many ecommerce brands calculate CLV/LTV only on revenue and order count – they ignore returns, COGS, shipping, and fees. The result is inflated numbers that don’t reflect reality.
True CLV shows the actual profit a new customer brings over time. Since most profit doesn’t come from the first order, knowing long-term value is crucial to decide how much you can invest in acquisition and which channels truly pay off.
True CLV profits turns short-term sales into long-term profit insights.
True CLV shows the actual profit a new customer brings over time. Since most profit doesn’t come from the first order, knowing long-term value is crucial to decide how much you can invest in acquisition and which channels truly pay off.
True CLV profits turns short-term sales into long-term profit insights.
Many ecommerce brands calculate CLV/LTV only on revenue and order count – they ignore returns, COGS, shipping, and fees. The result is inflated numbers that don’t reflect reality.
True CLV shows the actual profit a new customer brings over time. Since most profit doesn’t come from the first order, knowing long-term value is crucial to decide how much you can invest in acquisition and which channels truly pay off.
True CLV profits turns short-term sales into long-term profit insights.
True CLV shows the actual profit a new customer brings over time. Since most profit doesn’t come from the first order, knowing long-term value is crucial to decide how much you can invest in acquisition and which channels truly pay off.
True CLV profits turns short-term sales into long-term profit insights.
#4 Multi-market breakdowns
Aggregated data may look clear at first glance, but it often masks the real story. When revenue or profit shifts up or down, you need to know where it’s happening.
Is it a single market driving growth? A specific brand losing traction? Or just one store skewing the results? Breakdowns by market, brand, and store give you the visibility to spot these patterns instantly. Instead of reacting to vague totals, you can act on clear signals – doubling down on what’s working and quickly fixing what’s not. For ecommerce businesses, this level of granularity is the difference between flying blind and scaling with precision.
Is it a single market driving growth? A specific brand losing traction? Or just one store skewing the results? Breakdowns by market, brand, and store give you the visibility to spot these patterns instantly. Instead of reacting to vague totals, you can act on clear signals – doubling down on what’s working and quickly fixing what’s not. For ecommerce businesses, this level of granularity is the difference between flying blind and scaling with precision.

Aggregated data may look clear at first glance, but it often masks the real story. When revenue or profit shifts up or down, you need to know where it’s happening.
Is it a single market driving growth? A specific brand losing traction? Or just one store skewing the results? Breakdowns by market, brand, and store give you the visibility to spot these patterns instantly. Instead of reacting to vague totals, you can act on clear signals – doubling down on what’s working and quickly fixing what’s not. For ecommerce businesses, this level of granularity is the difference between flying blind and scaling with precision.
Is it a single market driving growth? A specific brand losing traction? Or just one store skewing the results? Breakdowns by market, brand, and store give you the visibility to spot these patterns instantly. Instead of reacting to vague totals, you can act on clear signals – doubling down on what’s working and quickly fixing what’s not. For ecommerce businesses, this level of granularity is the difference between flying blind and scaling with precision.
Want to know your metrics? Book a demo now:
#5 Know the exact profit at every product level
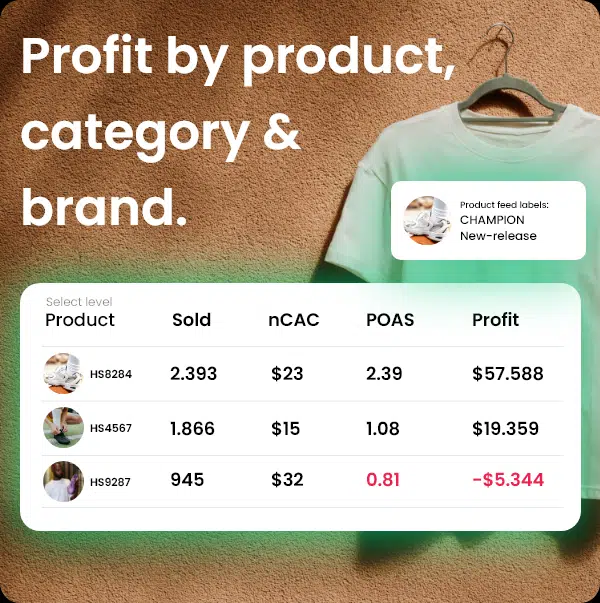
Top ecommerce brands don’t rely on gut feelings like ‘our Nike Detached line must still be the hero.’ They stay in the know – seeing exactly which products drive profit and which ones drain ad spend, so budgets go where performance truly is.
Furthermore, they smartly use product labelizers to feed this AI-driven knowledge into channels like Google Shopping Ads – ensuring the algorithm pushes profitable products, not just the ones that look good on revenue.
Furthermore, they smartly use product labelizers to feed this AI-driven knowledge into channels like Google Shopping Ads – ensuring the algorithm pushes profitable products, not just the ones that look good on revenue.
Top ecommerce brands don’t rely on gut feelings like ‘our Nike Detached line must still be the hero.’ They stay in the know – seeing exactly which products drive profit and which ones drain ad spend, so budgets go where performance truly is.
Furthermore, they smartly use product labelizers to feed this AI-driven knowledge into channels like Google Shopping Ads – ensuring the algorithm pushes profitable products, not just the ones that look good on revenue.
Furthermore, they smartly use product labelizers to feed this AI-driven knowledge into channels like Google Shopping Ads – ensuring the algorithm pushes profitable products, not just the ones that look good on revenue.
#6 CLV Profit : CAC Ratio
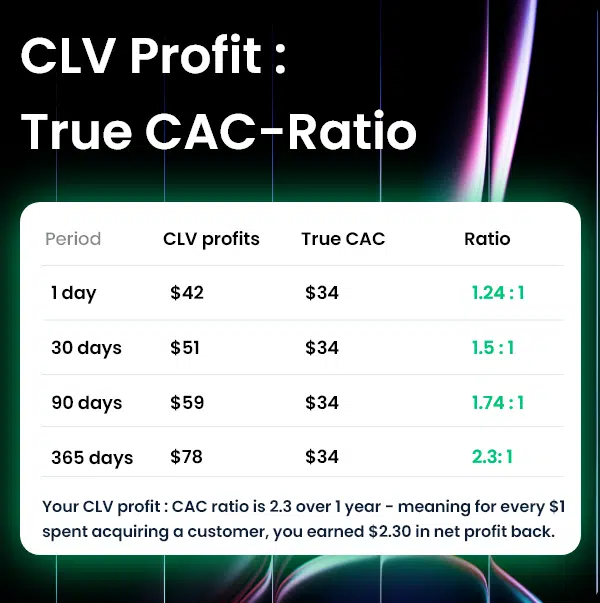
The CLV profit : True CAC ratio shows the real efficiency of your marketing. It tells you:
– How much net profit each customer generates over a period of ex. 1 – 365 days
– Compared to what it actually cost to acquire them (ads, discounts, payment fees, shipping, returns, etc.)
A ratio above 1.0 means growth is profitable. The higher the ratio, the more scalable your acquisition strategy.
– How much net profit each customer generates over a period of ex. 1 – 365 days
– Compared to what it actually cost to acquire them (ads, discounts, payment fees, shipping, returns, etc.)
A ratio above 1.0 means growth is profitable. The higher the ratio, the more scalable your acquisition strategy.
The CLV profit : True CAC ratio shows the real efficiency of your marketing. It tells you:
– How much net profit each customer generates over a period of ex. 1 – 365 days
– Compared to what it actually cost to acquire them (ads, discounts, payment fees, shipping, returns, etc.)
A ratio above 1.0 means growth is profitable. The higher the ratio, the more scalable your acquisition strategy.
– How much net profit each customer generates over a period of ex. 1 – 365 days
– Compared to what it actually cost to acquire them (ads, discounts, payment fees, shipping, returns, etc.)
A ratio above 1.0 means growth is profitable. The higher the ratio, the more scalable your acquisition strategy.
#7 New Customer Revenue vs. Repeat Customer Revenue
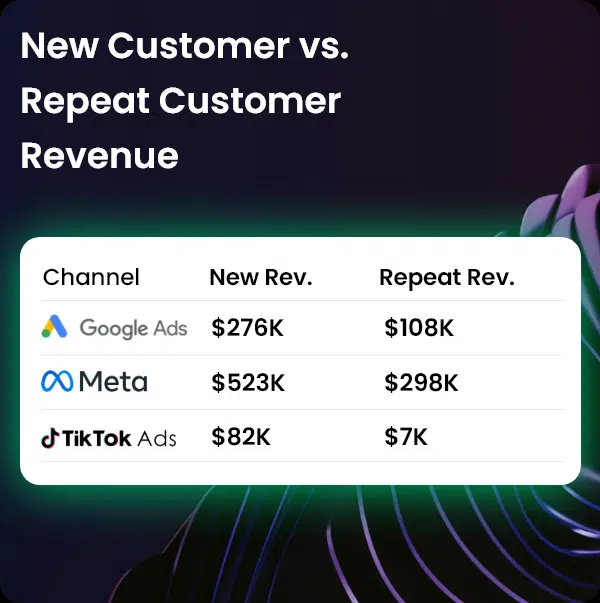
Ad platforms like Meta and Google often overstate “new customer” revenue. Their definition is usually siloed – it can’t see if the buyer was already a customer from another channel, had purchased before, or came back after a return.
You may think you’re winning new customers, when in reality you’re paying again for repeat ones if you look at marketing platform data.
Reaktion solves this by sending back true new and repeat customer data to your marketing platforms.
You may think you’re winning new customers, when in reality you’re paying again for repeat ones if you look at marketing platform data.
Reaktion solves this by sending back true new and repeat customer data to your marketing platforms.
Ad platforms like Meta and Google often overstate “new customer” revenue. Their definition is usually siloed – it can’t see if the buyer was already a customer from another channel, had purchased before, or came back after a return.
You may think you’re winning new customers, when in reality you’re paying again for repeat ones if you look at marketing platform data.
Reaktion solves this by sending back true new and repeat customer data to your marketing platforms.
You may think you’re winning new customers, when in reality you’re paying again for repeat ones if you look at marketing platform data.
Reaktion solves this by sending back true new and repeat customer data to your marketing platforms.
The difference between struggling to grow and scaling profitably often comes down to one thing: tracking the right metrics.
Running e-commerce without tracking the right metrics is a bit like driving a Tesla with the screen turned off. Yep, it moves, but you’ve got no clue about speed, charge, or where you’ll end up.
By measuring and optimizing around True CAC, POAS, CLV Profits, Multi-market Breakdowns, Exact Product-level Profit, CLV Profit:CAC Ratio, and the split between New vs. Repeat Customer Revenue, you give yourself the same level of clarity the fastest-growing brands use to stay ahead. That’s why the biggest agencies and top-performing brands don’t just track revenue — they track profit, returns, customer value, and more. If you want to scale with confidence, these seven metrics are your roadmap.
By measuring and optimizing around True CAC, POAS, CLV Profits, Multi-market Breakdowns, Exact Product-level Profit, CLV Profit:CAC Ratio, and the split between New vs. Repeat Customer Revenue, you give yourself the same level of clarity the fastest-growing brands use to stay ahead. That’s why the biggest agencies and top-performing brands don’t just track revenue — they track profit, returns, customer value, and more. If you want to scale with confidence, these seven metrics are your roadmap.