

Reaktion Academy
Understanding the Customer Lifetime Value Report in Reaktion
Understanding Customer Lifetime Value (CLV) is pivotal for e-commerce businesses as it offers a holistic perspective on the value each customer contributes throughout their entire engagement with the company. CLV serves as a powerful metric that goes beyond immediate transactions, allowing businesses to strategically allocate resources and tailor their marketing efforts effectively. By calculating CLV, companies can identify and nurture high-value customers, optimise customer acquisition costs, and prioritise retention strategies. This understanding not only enhances profitability but also fosters long-term customer relationships and sustains competitive advantage in the dynamic e-commerce industry.
In Reaktion, we have a dedicated report for CLV Analysis called the Lifetime Value Report where you can view in-depth metrics related to revenue and profit over time and a cohort analysis of your customers’ LTV. We do not calculate CLV for just revenue, but also for profit, repurchase rate, CAC, etc. You can access the Lifetime Value Report here.
Before proceeding to look at the data in this report, please ensure that you have selected the right time frame and the correct web shop(s). Since most of the metrics in this report are for looking at data over a period of time, choosing the accurate time period is very important. And, selecting the correct web shop(s) would give you a shop-level breakdown if needed.
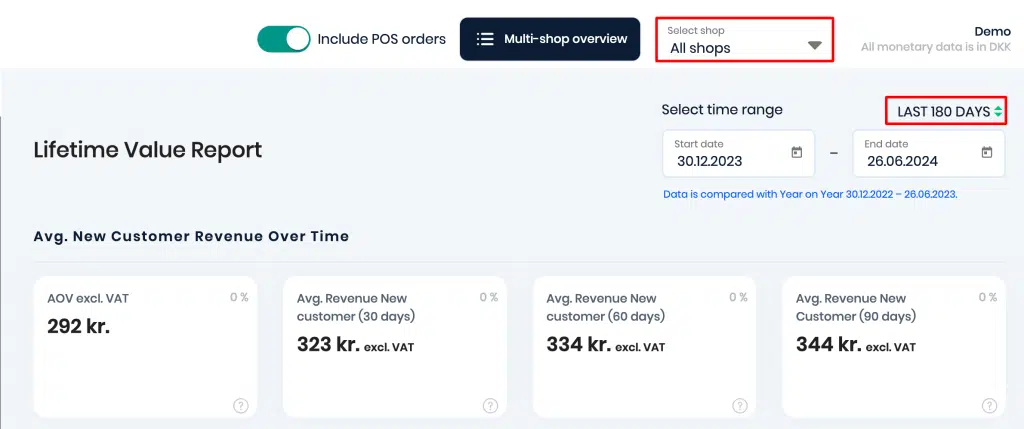
Here is a breakdown of the various sections in the report:
Avg. New Customer Revenue Over Time – based on the time period selected, this gives you an overview of AOV and average revenue of new customers from 30 to 90 days.
AOV excl. VAT – Average Order Value is a metric used to measure the average sales incl. VAT generated per sale. Average Order Value (AOV) = Total sales incl. VAT / Number of Sales
Avg. Revenue New Customer – this gives you the value of total sales generated over a period of 30, 60, and 90 days. Please note that these values are excluding VAT.
Avg. New Customer Gross Profit Over Time – based on the time period selected, this gives you an overview of average LTV of profit for the first order, 60 days and 90 days.
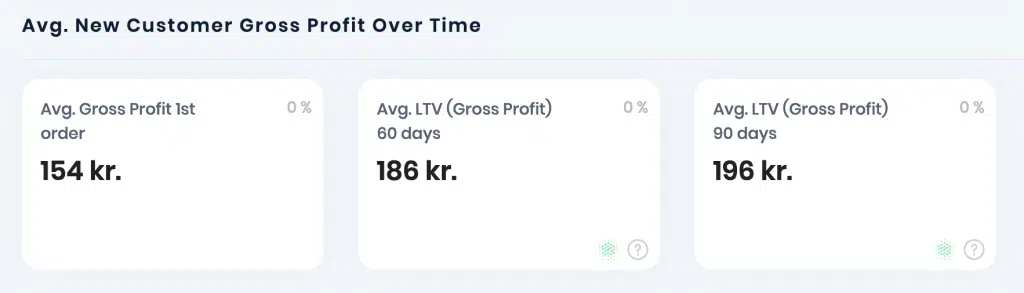
Gross Profit is calculated as Revenue minus all costs ( COGS, shipping, Pick & Pack, payment fees and VAT (except marketing costs)). For the 60 days and 90 days tiles, the data is based on Reaktion calculated or tracked data. We use our own server-side tracking solution for more accurate tracking results on orders and revenue, compared to standard browser based tracking.
CAC / LTV Ratio – This ratio compares how much it costs to acquire a customer with how much revenue (and ultimately profit) that customer is expected to generate over their lifetime. It helps businesses assess whether their customer acquisition costs are justified by the revenue those customers generate.
Ideally, a healthy ratio is typically considered to be 1:3 or better (CAC should be less than one-third of LTV). This indicates that the revenue from a customer over their lifetime is at least three times the cost of acquiring that customer.
Based on the time range selected, you can view a Blended webshop CAC for all your shops, and also view what is the ratio for LTV (Gross profit) (90/180 days or 12 months) and Blended webshop CAC –
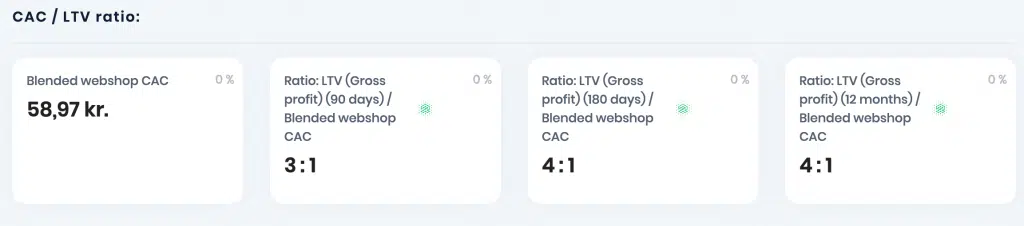
The general webshop CAC is calculated by dividing your entire ad spend across all channels by the total number of new customers in any given period of time.
Cohort analysis of your customers’ LTV – Cohort analysis in Reaktion refers to evaluating the performance and behaviour of groups of customers who share common characteristics or experiences over time. These groups, or cohorts, are typically defined by the customers’ first interactions with the business, such as their first order date or repurchase rate.
Based on a time frame and desired metric, you can view the cohort data for your customers with insights on new customers, repurchase rate, CAC, and how the growth trend looks like over a period of time.
For example, if you would like to track the gross profit per customer over the last 180 days, you can choose the time frame as ‘Month’ and select the ‘Gross Profit excl. VAT per customer’ metric –
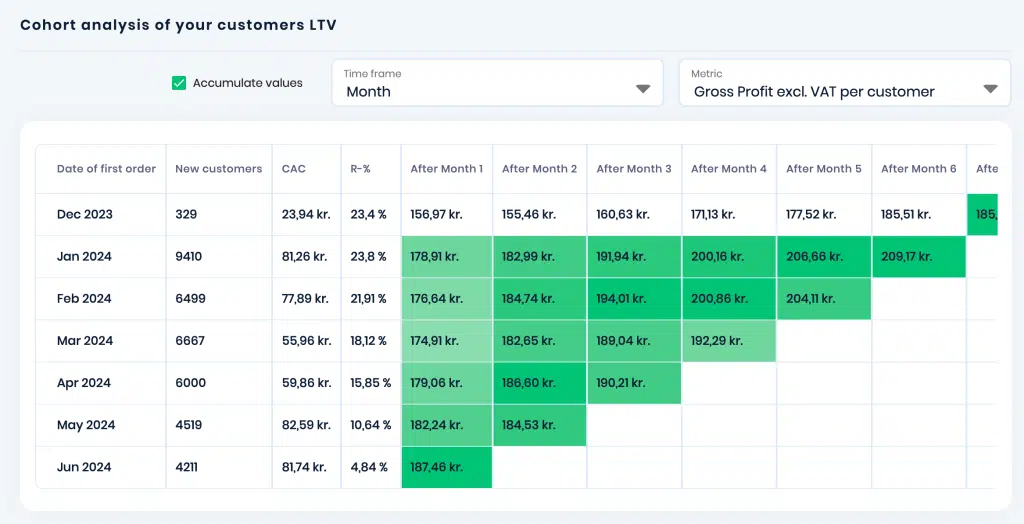
For every month, you can see how the gross profit value increases over time with repeat purchases of the orders. The repurchase rate also known as repeat purchase rate, refers to the percentage of customers who make a repeat purchase from a company within a specific period. This gives you an indication whether or not a certain product is well-liked or disliked by your customers. You can also see the number of new customers every month and their CAC for every month.
You can select any of the following metrics to do a cohort analysis on – Gross Profit excl. VAT, Gross Profit excl. VAT per customer, Orders, Orders per customer, Total Sales incl. VAT, and Total Sales incl. VAT per customer.
In conclusion, cohort analysis is a powerful tool in e-commerce for understanding customer behaviour, improving retention, optimising marketing strategies, and ultimately enhancing business performance through data-driven insights.