

Reaktion Academy
E-commerce Reports in Reaktion
E-commerce reports are essential for understanding your business’s performance, making informed decisions, and optimising various aspects of your online operations. They provide critical insights into financial health, customer behaviour, and marketing effectiveness, all of which are necessary for driving growth and ensuring long-term success.
Reaktion offers a dedicated e-commerce reports section comprising of six reports. To access the overall reports section, please click here.
Monthly, weekly or daily performance break down Report – Report Link.
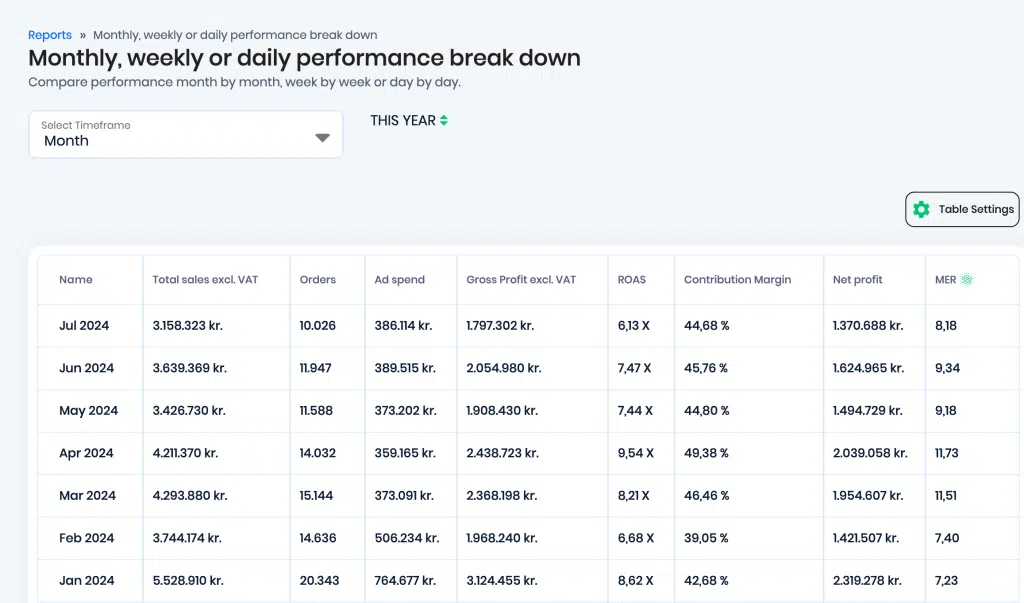
This report gives you a breakdown of the performance which you can compare month by month, week by week or day by day. Based on the timeframe and web shop(s) selected, you can view the data for Total Sales incl. VAT, number of orders, Ad Spend, Gross Profit excl. VAT, ROAS, Contribution Margin, and Net Profit –
Profit & Loss Statement Report – Report Link.
This report can be used to get an overall overview of your e-commerce performance and financial metrics. Based on the web shop(s) and time frame selected, you can view the following financial metrics –
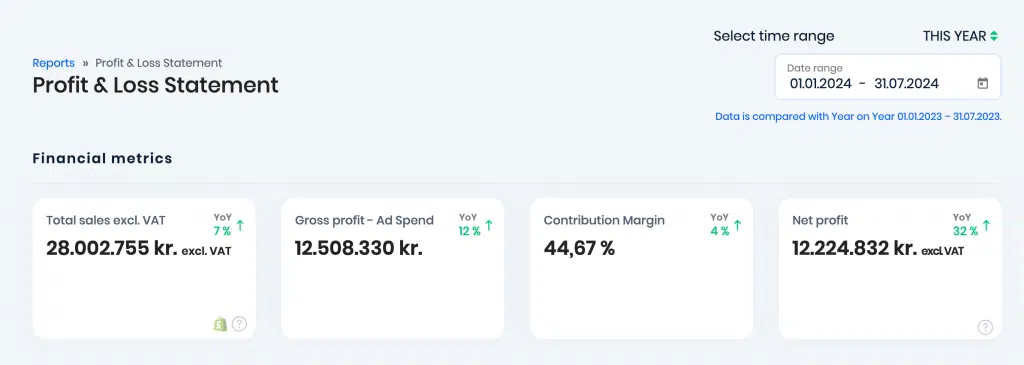
Total Sales excl. VAT – refers to the total sales generated excluding VAT and refunds.
Gross Profit – Ad Spend – Gross Profit is calculated as Revenue minus all costs ( COGS, shipping, Pick & Pack, payment fees and VAT (except marketing costs)) and Ad spend refers to the total amount of money a company allocates and spends on advertising activities within a specific period.
Contribution Margin – Contribution Margin is calculated as the difference between sales revenue and variable costs. It represents the portion of sales revenue that exceeds variable costs and contributes to covering fixed costs and generating profit.
Net profit – Net profit is all revenue minus all expenses both variable, recurring and one-time within the selected period. In Reaktion, Net profit = Gross profit – Ad spend. In some cases, Gross profit and net profit can be the same if you do not have any other additional expenses. The numbers are excluding VAT – in Reaktion, we always use values excluding VAT to be able to report on the true Net Profit.
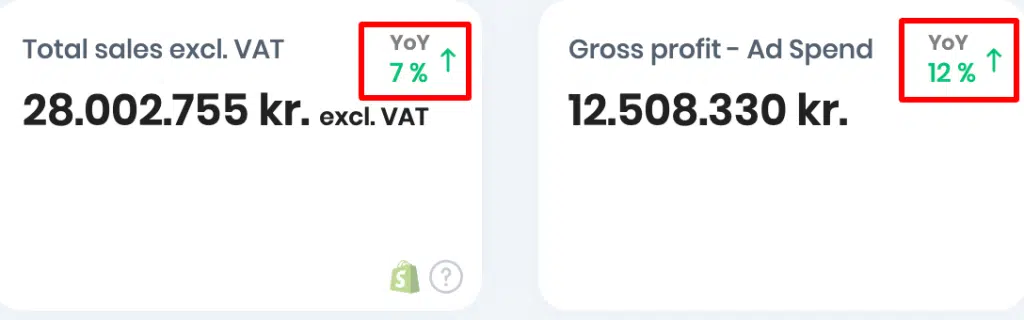
On all these metrics, you can see the comparative performance, for example YoY –
The second section of this report allows you to split your profit and loss statement by the following filters – No split, Weekly, Monthly, Quarterly, Annual, Webshop, Product Type and Brand –
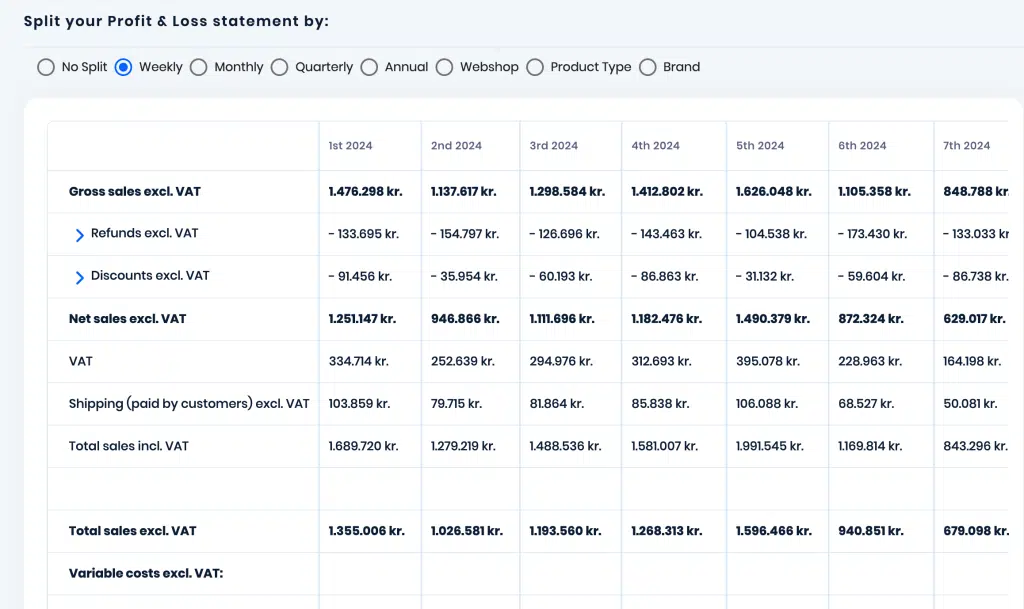
Depending on the filter chosen, you can get detailed insights into a lot of Sales metrics.
Country Performance Report – Report Link.
This report can be used to get a breakdown of your performance per country (based on customer’s shipping address). For every country, you can see the total number of Orders, Total Sales including VAT, and Gross Profit excluding VAT.
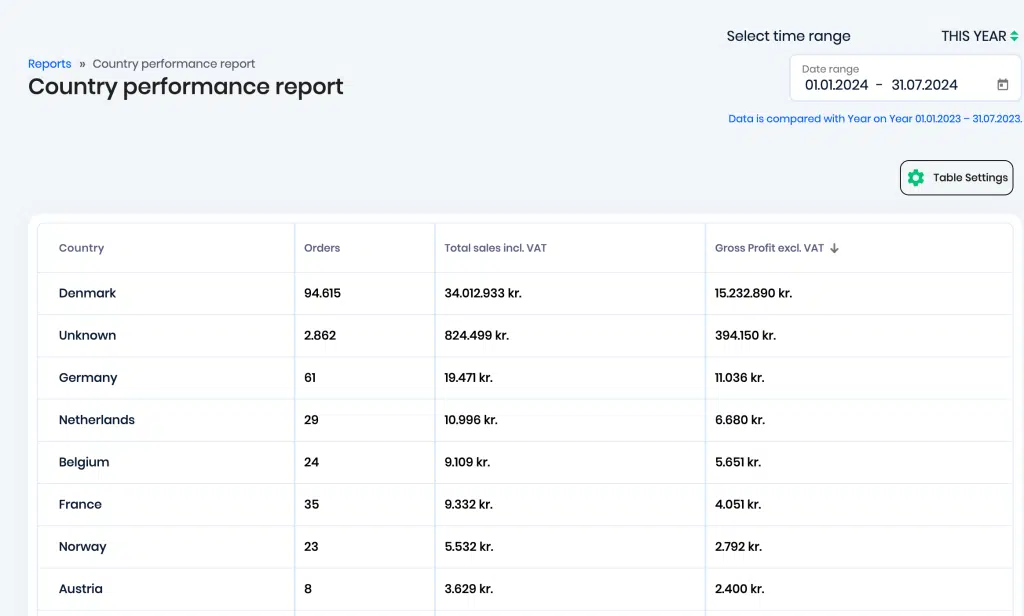
Clicking on any of the numbers will also give you a graphical representation of the metric trends over the time period selected –

Discount Code Performance Report – Report Link.
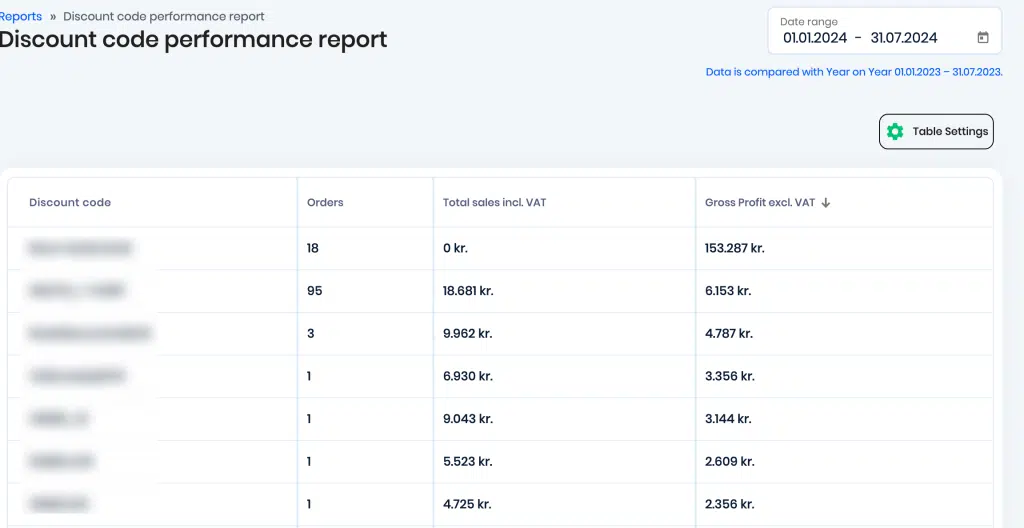
This report can be used to get insights on the most and least profitable discount coupon codes. For each discount code, you can see the total number of Orders, Total Sales including VAT, and Gross Profit excluding VAT.
Expenses Report – Report Link.
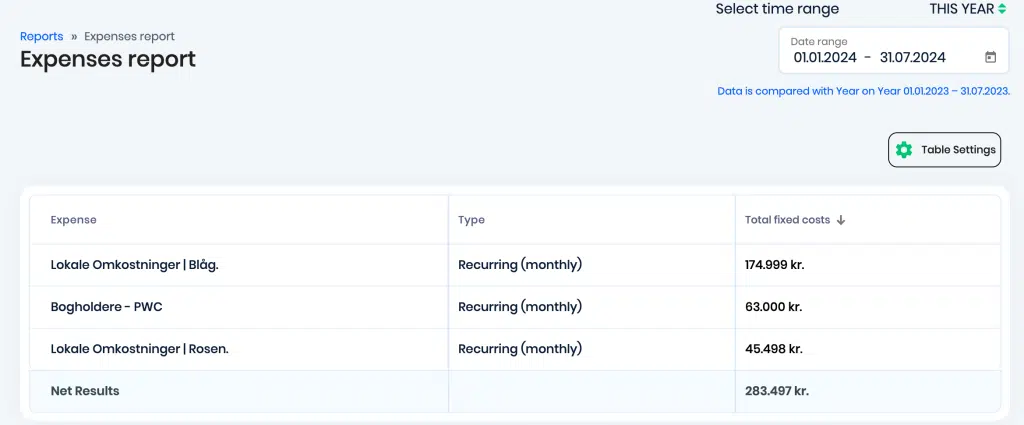
This report can be used to get an overview of your custom expenses like agency fee, office rent, etc. Based on the expense, you can see the type of expense and the total fixed costs.
Live Orders Report – Report Link.
This report can be used to get an overall overview of your orders. Based on the timeframe and web shop(s) selected, you can view a summary of total orders in that time period, orders with positive gross profit and orders with negative gross profit.
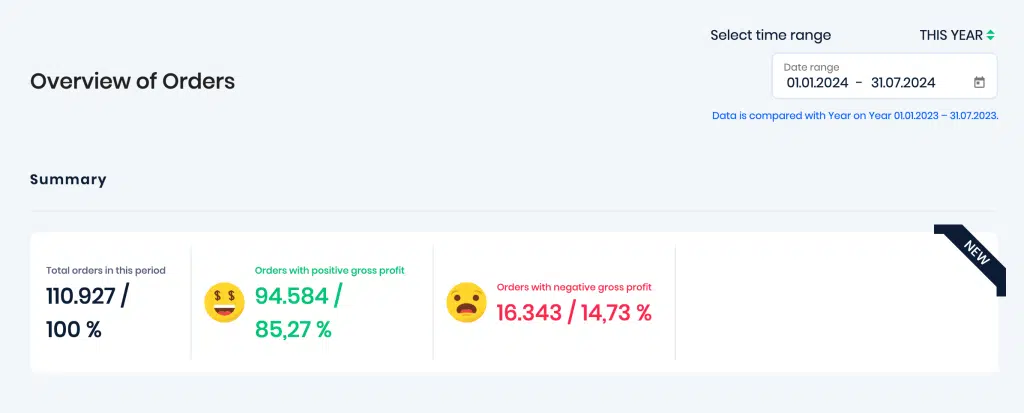
If you scroll down, there is a separate Orders overview section that gives you detailed information about individual orders like Customer Journey, Order Value, COGS, Returns, Refunds, etc.
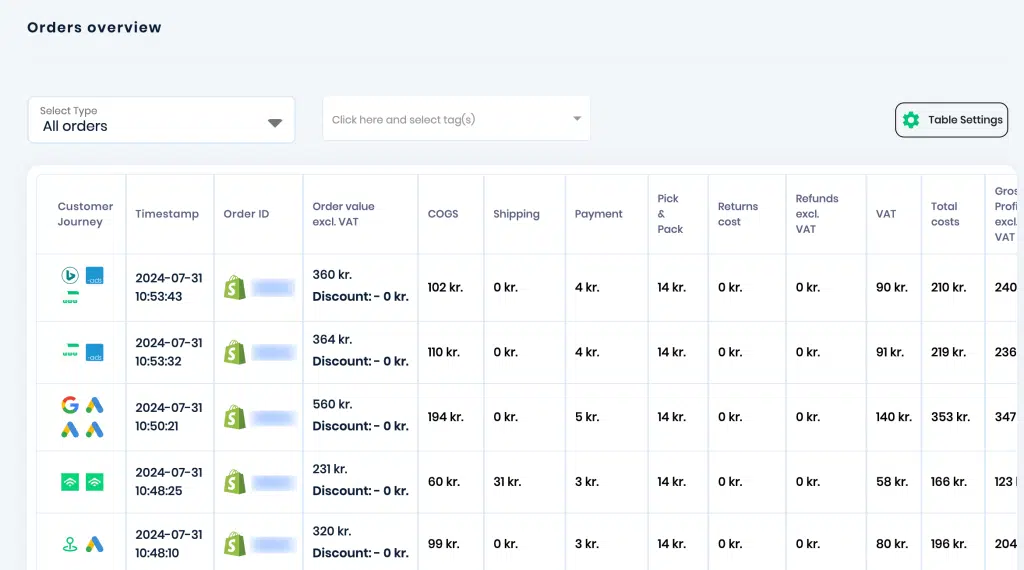
You can also choose what type of Orders you would like to view the data for – All Orders, Live Orders, or Live Returns using the filter at the top left corner.
That covers all the e-commerce reports in Reaktion.