

Reaktion Academy
Maximising profits using our Google Ads Dashboard
Reaktion offers a dedicated Google Ads dashboard which can be used to view all your profit metrics, get valuable insights into how your campaigns are performing, returns and refunds, view trends and so much more. Looking at profit metrics for Google Ads in e-commerce provides a holistic view of the financial impact of your advertising efforts. It goes beyond simple revenue metrics to show how effectively your marketing investments are driving profitability and contributing to the overall success of your business.
Access the Google Ads Dashboard here.
The Google Ads Dashboard is divided into the following tabs – Overview, Campaigns, Engagement, Video, Returns, New Customers, Placement, and Trend.
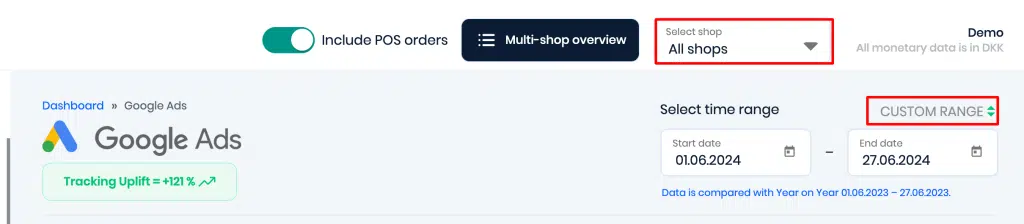
Before looking at the data on the dashboard, please ensure that you have selected the right time frame and the desired web shop(s) if you prefer a shop-level breakdown –
Here is a breakdown of all the Tabs:
Overview Tab – This tab gives you an overview of all your important revenue and profit metrics –
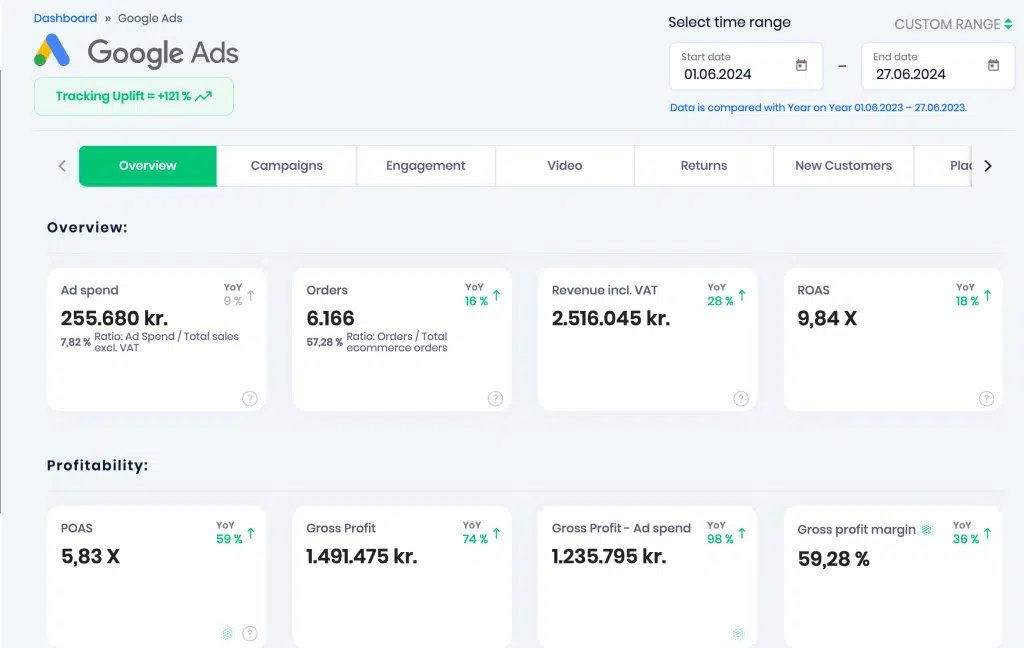
You can also see the YoY (Year on Year) performance increase/decrease against all the metric tiles in the dashboard.
Overview : These are the key metrics under the Overview section:
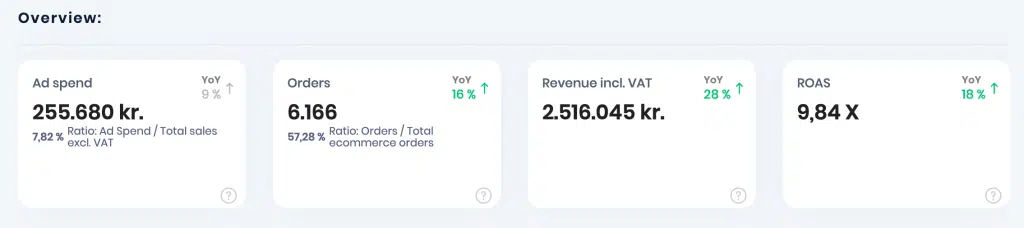
Ad spend – Ad spend refers to the total amount of money a company allocates and spends on advertising activities within a specific period. This budget can be spread across various channels and platforms, depending on the company’s marketing strategy and goals. The ad spend ratio is calculated as Ad spend / Total sales excl. VAT.
Clicking on this metric gives you a timeline graph between Time range ad spend and Comparative ad spend –
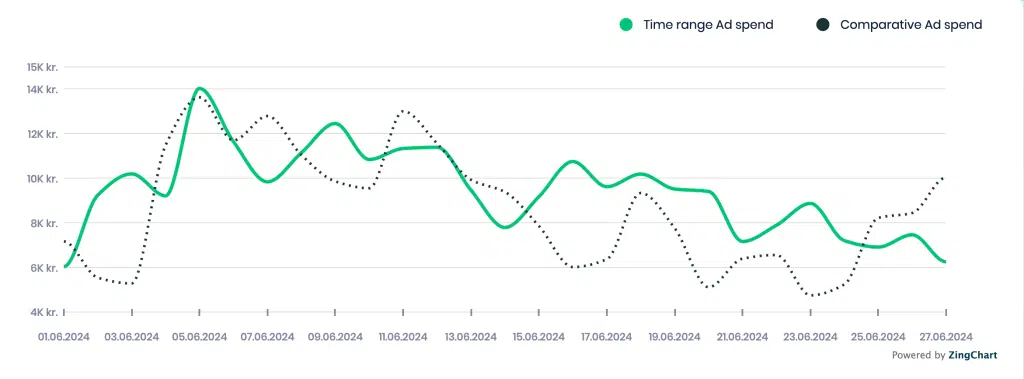
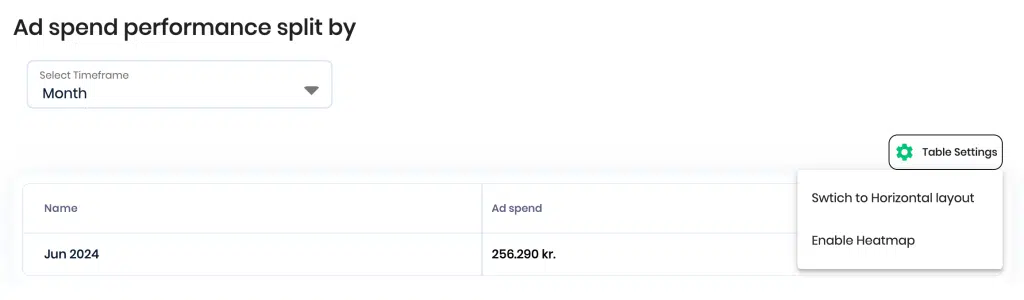
You can also view a ad spend performance split by a selected time period like day, week, month, etc along with options to switch to a horizontal layout or enabling heatmap –
Orders – Orders refer to the total number of sales generated by customers purchasing goods/services. These requests can be placed through various channels such as online platforms, physical stores, or over the phone. This can also be referred to as Sales.
You can also view a ratio of Orders calculated as Orders / Total e-commerce orders.
Revenue incl. VAT – total amount of money generated from sales or services, including the Value Added Tax (VAT). When revenue is stated as “including VAT,” it means the total revenue figure already has VAT factored into it. This is important for businesses to distinguish, as they need to know the portion of their revenue that is actual sales income and the portion that is tax.
ROAS – Return on Ad Spend. ROAS is used to measure the revenue generated for every unit of currency spent on advertising. ROAS helps businesses evaluate the effectiveness of their advertising campaigns and optimize their advertising budget allocation.
ROAS = revenue generated from sales / ad spend
Profitability: These are the key metrics under the Profitability section –
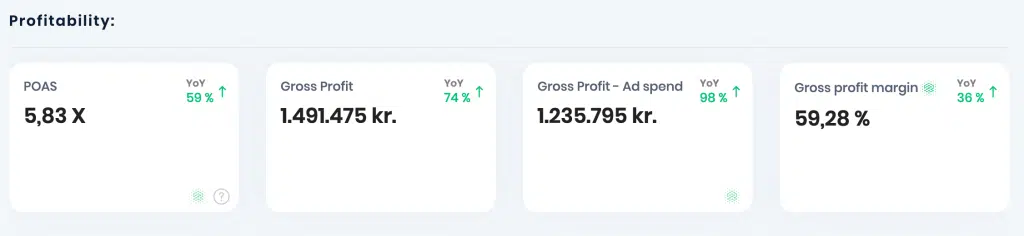
POAS – Profit on Ad Spend. POAS is calculated as Gross profit from ad campaigns / Ad spend. All the costs (including shipping, payment fees, etc) are taken into account, and the custom expenses too, when calculating POAS. We do not take into account orders that didn’t come from your ad campaigns.
POAS = Gross profit / attributed ad spend that generated the gross profit.
Gross Profit – Gross Profit measures the profitability of a company after deducting the cost of goods sold (COGS) from its total revenue. It represents the amount of money a company retains from sales after covering the direct costs associated with producing its goods or services.
Gross Profit=Total Revenue−Cost of Goods Sold (COGS)
Gross Profit – Ad spend – this gives you the value of your Gross Profit minus the ad spend for the selected time frame.
Gross Profit Margin – Gross Profit Margin is a key financial metric that measures the profitability of a company’s products or services by expressing gross profit as a percentage of total revenue. It indicates how much money is retained from sales after accounting for the cost of goods sold (COGS), which includes direct production costs such as materials, labor, and manufacturing overhead.
Unit Economics: Unit Economics are the fundamental financial metrics that pertain to the direct revenues and costs associated with selling a single unit of a product or service. These are the key Unit Economics metrics –
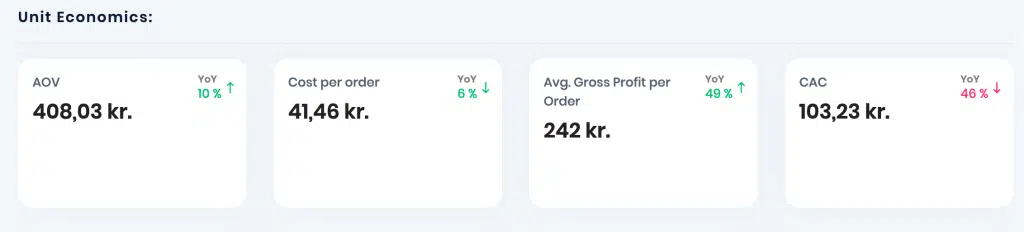
AOV – Average Order Value is a metric used to measure the average sales incl. VAT generated per sale. Average Order Value (AOV) = Total sales incl. VAT / Number of Sales
Cost per Order – Cost Per Order (CPO) is a metric used to measure the average cost incurred to acquire a single order or transaction. It is calculated by dividing the total cost of marketing or advertising campaigns by the number of orders received during a specific period.
Avg. Gross Profit per Order – refers to the average amount of profit generated from each individual order after deducting the cost of goods sold (COGS) associated with those orders. It is a key financial metric that helps businesses assess the profitability of their sales transactions.
CAC – Customer Acquisition Cost. It represents the average cost a business incurs to acquire a new customer. Calculating CAC is important for businesses to understand the effectiveness of their marketing and sales efforts and to ensure that the cost of acquiring customers does not exceed the lifetime value of those customers.
New Customers: These are the key metrics under the New Customers section –
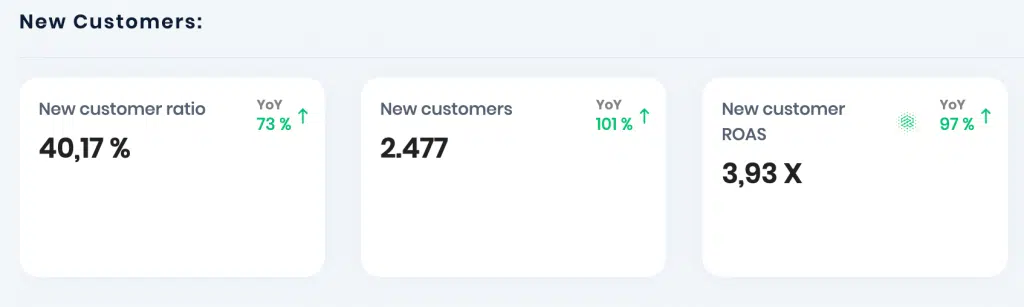
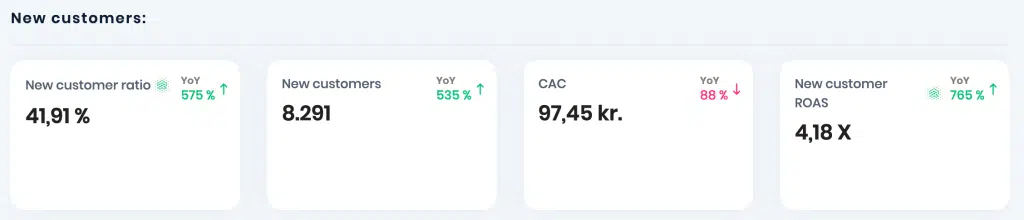
New customer ratio – refers to the percentage of new customers acquired by a business within a specific period, typically compared to the total number of customers acquired (new and existing) during the same period. It is a key metric used to measure the effectiveness of customer acquisition efforts and the growth of a customer base.
New customers – New Customers are the Count of Unique Customers who placed their first Order in the selected Date Range. These are customers who have never purchased from your store before.
New customer ROAS – refers to the Return on Advertising Spend specifically attributed to new customers acquired during a marketing campaign or a specified period. ROAS (Return on Ad Spend) itself is a metric that measures the revenue generated for every dollar spent on advertising.
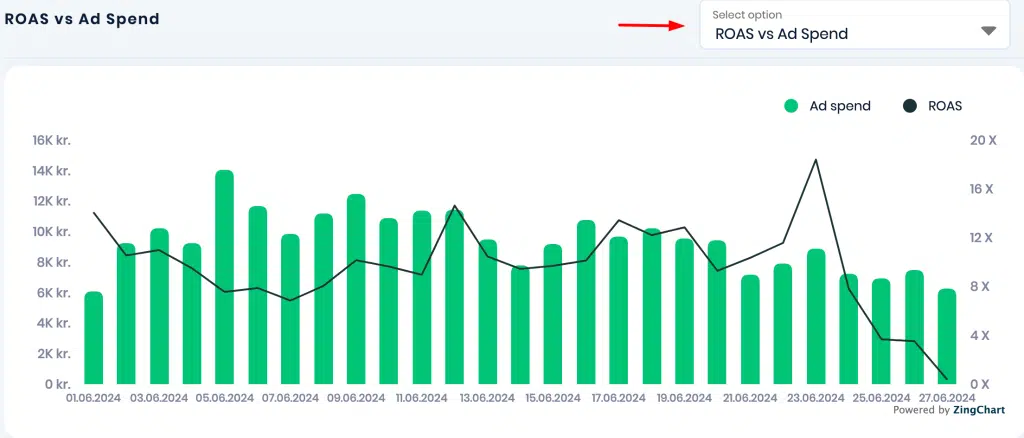
ROAS vs Ad Spend: The last section under Overview dashboard lets you compare your Ad Spend metric against the following metrics – ROAS, Cost per Order, Customer acquisition cost, POAS, and Revenue incl. VAT. You can choose the comparison metrics from the dropdown and view the chart data –
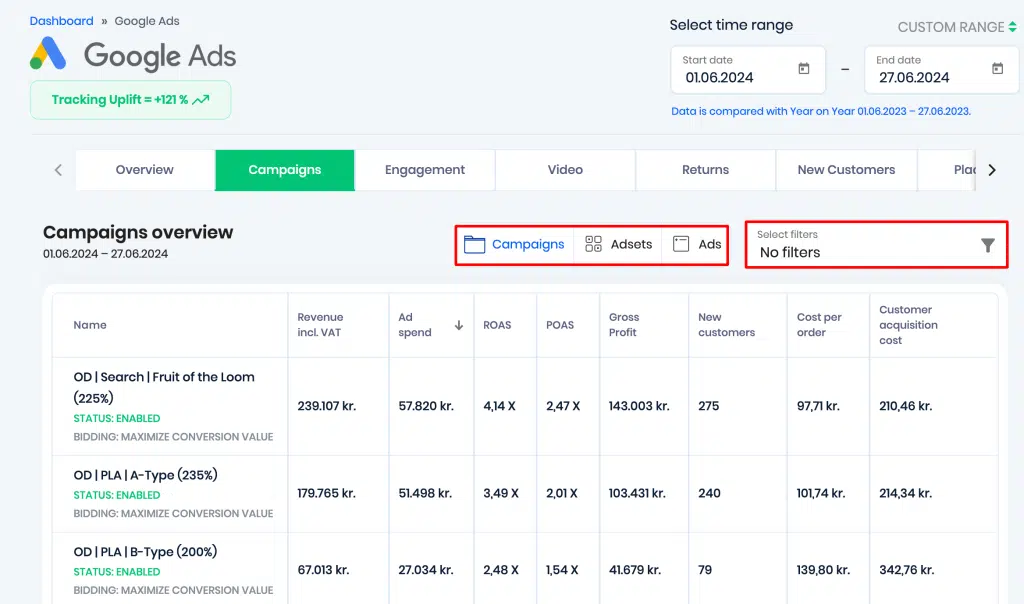
Campaigns Tab – The Campaigns tab gives you an overview of how your campaigns are performing and view key revenue, profit and unit economics metrics. You can also apply filters to see a campaign / ad-set / ad level breakdown and drill down even further by filtering the values with your desired metrics –
Engagement Tab – The Engagement tab gives you an overview of the most commonly looked at engagement metrics –
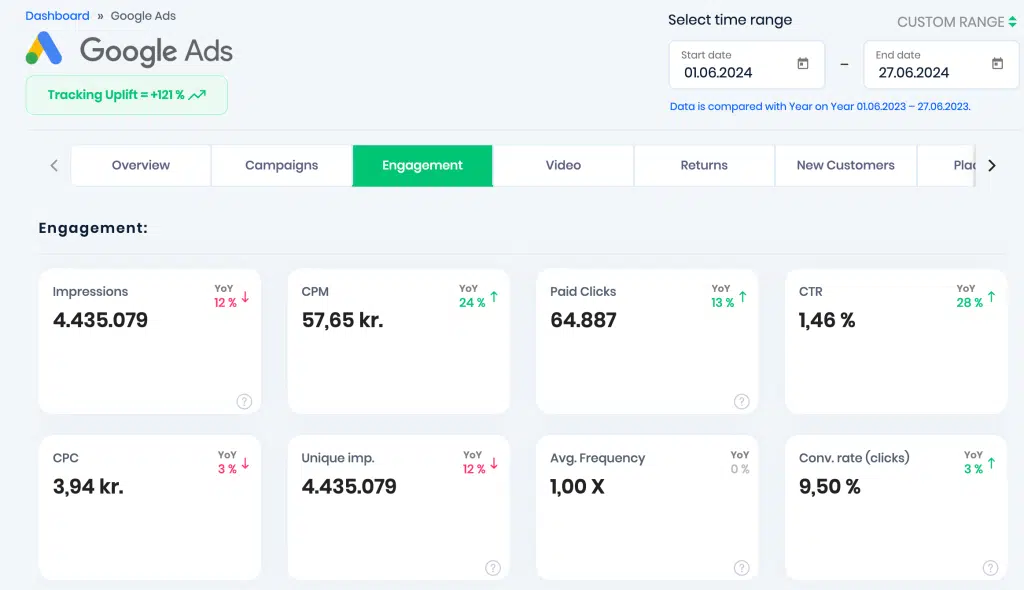
Impressions – refer to the number of times an advertisement or promotional content is displayed on a user’s screen. It is a metric used to measure the visibility and exposure of ads to potential customers.
CPM – Cost Per Mille, which translates to the cost per one thousand impressions. CPM is a common pricing model used in advertising, especially in online and digital advertising, to determine the cost of reaching one thousand potential customers or viewers.
Paid Clicks – refers to the number of unique clicks users click on a paid advertisement, such as a pay-per-click (PPC) ad, sponsored post, or promoted listing. These clicks are typically generated through online advertising platforms like Google Ads or Meta Ads where advertisers pay for each click on their ads.
CTR – Click-Through Rate. It is a metric used to measure the effectiveness of an online advertising campaign.
CTR = (Number of clicks / Number of Impressions) x 100
CPC – Cost Per Click. It is a pricing model used in online advertising, where advertisers pay a certain amount each time their ad is clicked. CPC is commonly used in search engine advertising, social media advertising, and display advertising.
CPC = Total cost of clicks / Number of clicks
Unique impressions – A unique impression is counted when an ad is served for the very first time in a span of 24 hours.
Avg. Frequency – refers to the average number of times that each person viewed your ad.
Conversion rate (Clicks) – refers to the number of sales divided by the total number of unique clicks.
Video Tab – This gives you an overview of how your video campaigns are performing and allows you to monitor key performance metrics related to these campaigns. There is also the ability to filter your results by searching for specific keywords associated with your campaigns or specific metrics –
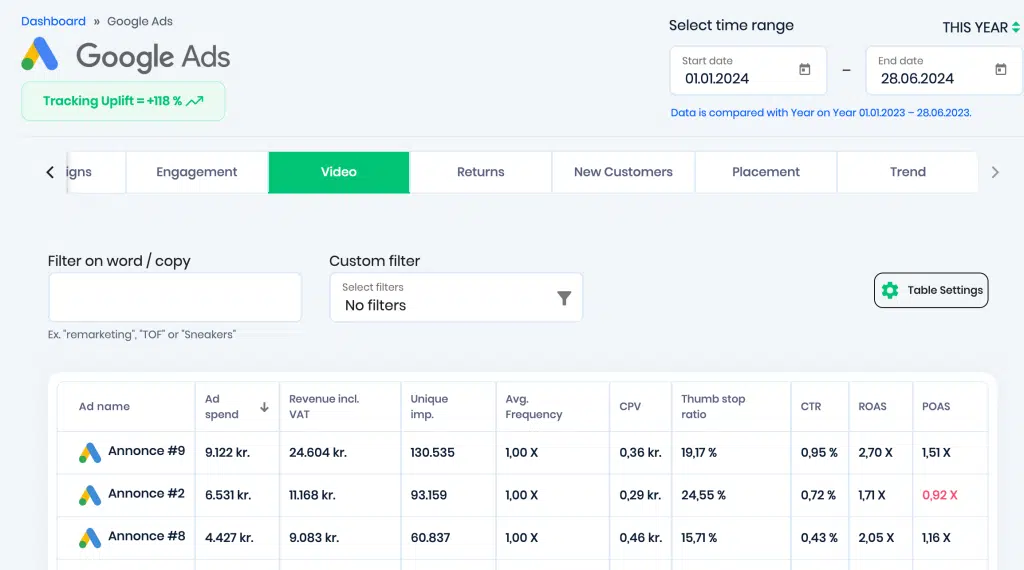
CPV – Cost Per View. It is a pricing model used in advertising, particularly in video advertising, where advertisers pay a certain amount each time their video ad is viewed by a user. CPV is often used in online video advertising campaigns, such as pre-roll ads on YouTube.
Thumb stop ratio – this metric is calculated as 3 second video plays divided by Impressions. The Thumb stop rate of your Meta Ads can be an incredibly valuable metric that demonstrates how effectively your videos are engaging audiences as they scroll their feeds.
Returns Tab – This gives you an overview of all your refund and returns related metrics, an overview graph of how these metrics evolved over a time period and a campaign level breakdown of refunds and returns. Here are the key metrics –

Refunds – refers to the refunds of fully or partially refunded orders. Refunded orders are attributed to the order creation date.
Refund value – refers to the total value of the refunded orders within a specific time period.
Refund rate – refers to the percentage of purchases that are refunded by customers fully or partially within a specific period. It is a metric used to measure customer satisfaction, product quality, and overall business performance
ROAS after Refunds – refers to the Return on Ad Spend (ROAS) after the refunds are initiated.
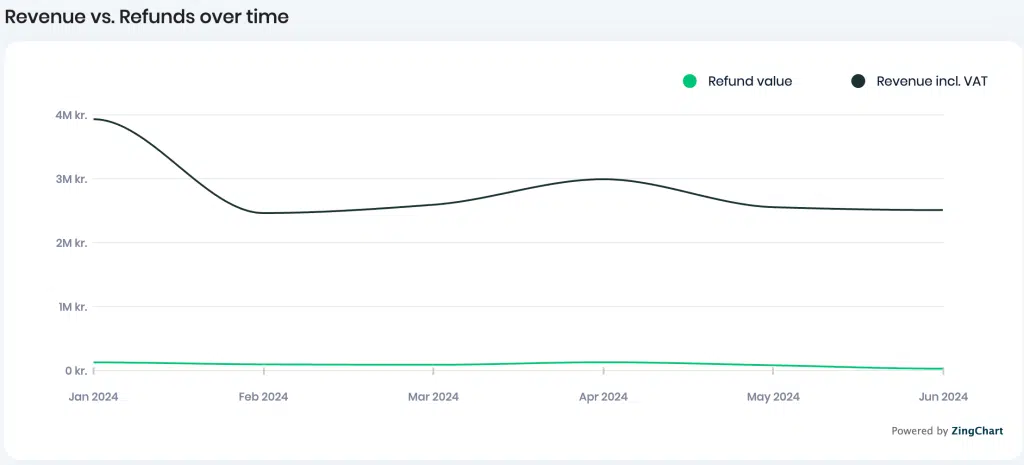
Based on the time frame selected, you can also view a graph of how the revenue versus refund trend looks like over time –
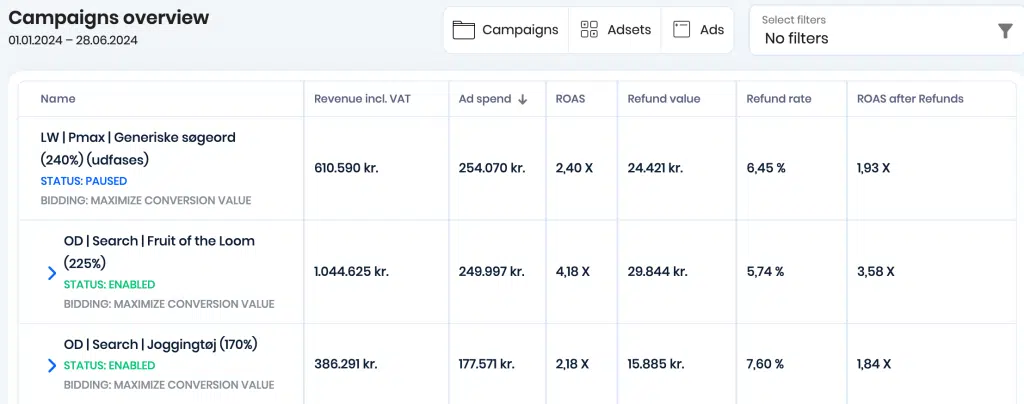
You can also get a campaign level breakdown of how the refund metrics look like for all your campaigns. This can be further filtered by campaigns/ ad-sets/ ads and other metrics –
New Customers Tab – This gives you an overview of all the metrics that measure the performance of your new customers how their average lifetime value looks like over specific time periods. These are the key metrics, which are similar to the ‘New customers’ section in the Overview Tab –
You can also view the Average Lifetime Value in terms of Revenue and Profit for the last 90 days. Similarly, you can view the CAC/LTV Ratio in terms of Revenue and Profit for the last 90 days –
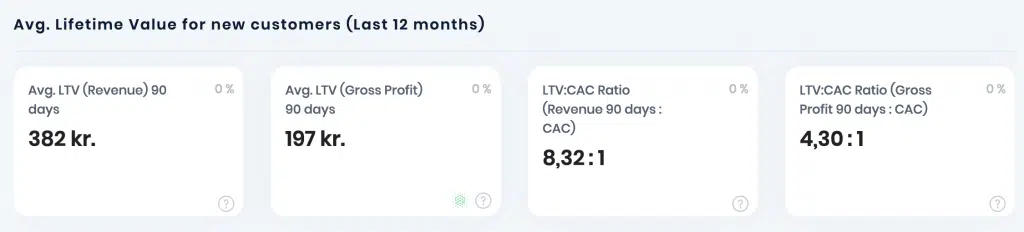
CAC / LTV Ratio – This ratio compares how much it costs to acquire a customer with how much revenue (and ultimately profit) that customer is expected to generate over their lifetime. It helps businesses assess whether their customer acquisition costs are justified by the revenue those customers generate.
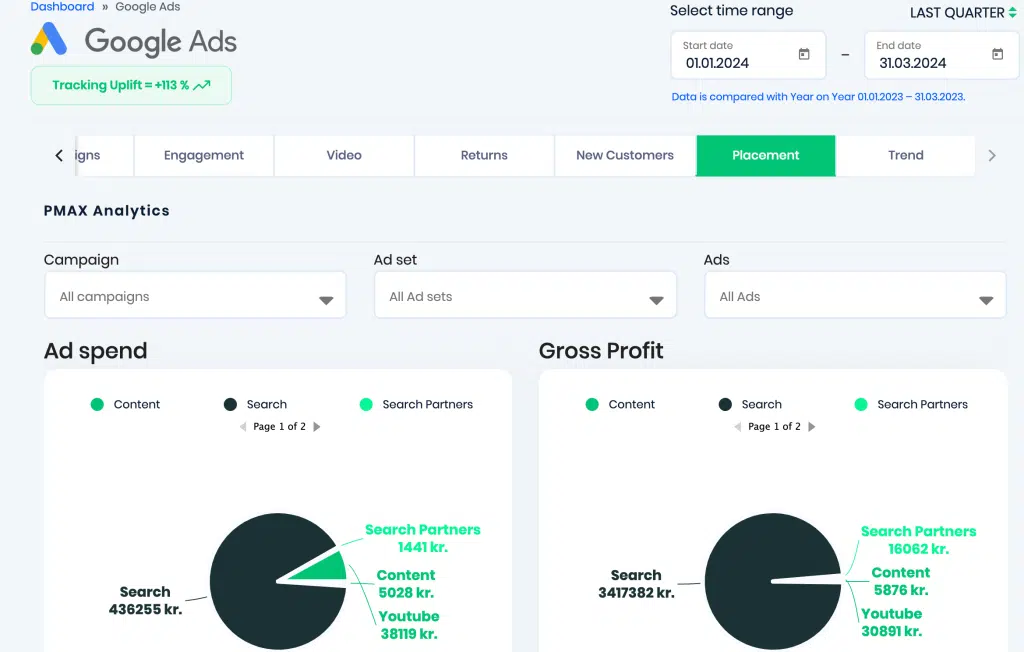
Placement Tab – This gives you an overview of your ad placements, and the various types of sources that impact your metrics.
You can choose to filter this data at a campaign/ ad-set/ ad level and see how key metrics like Ad spend, Gross Profit, Orders, and Revenue incl. VAT are derived and distributed across sources like direct search, YouTube, other digital content or search partners –
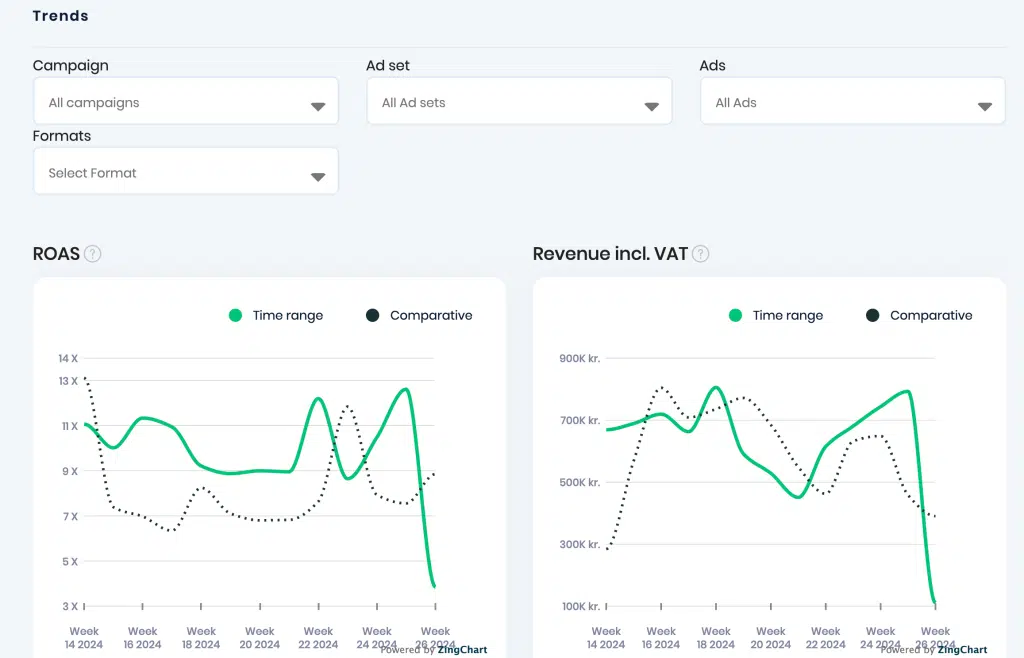
Trend Tab – This gives you a graphical breakdown of all your key revenue, profit, and unit economics metrics over the selected time frame. This can also be filtered further on a campaign/ ad-set/ ad level and the format type such as video, text, shopping or responsive ads –
That covers all the various tabs and sections of Reaktion’s Google Ads Dashboard in detail.